Entropic Timer: The Information Entropy of Crossing the Street
You know those countdown timers at crosswalks? Sometimes when crossing the street, I like to try to guess what number it’s on even when I can’t see the whole thing (like when approaching the intersection at an oblique angle).
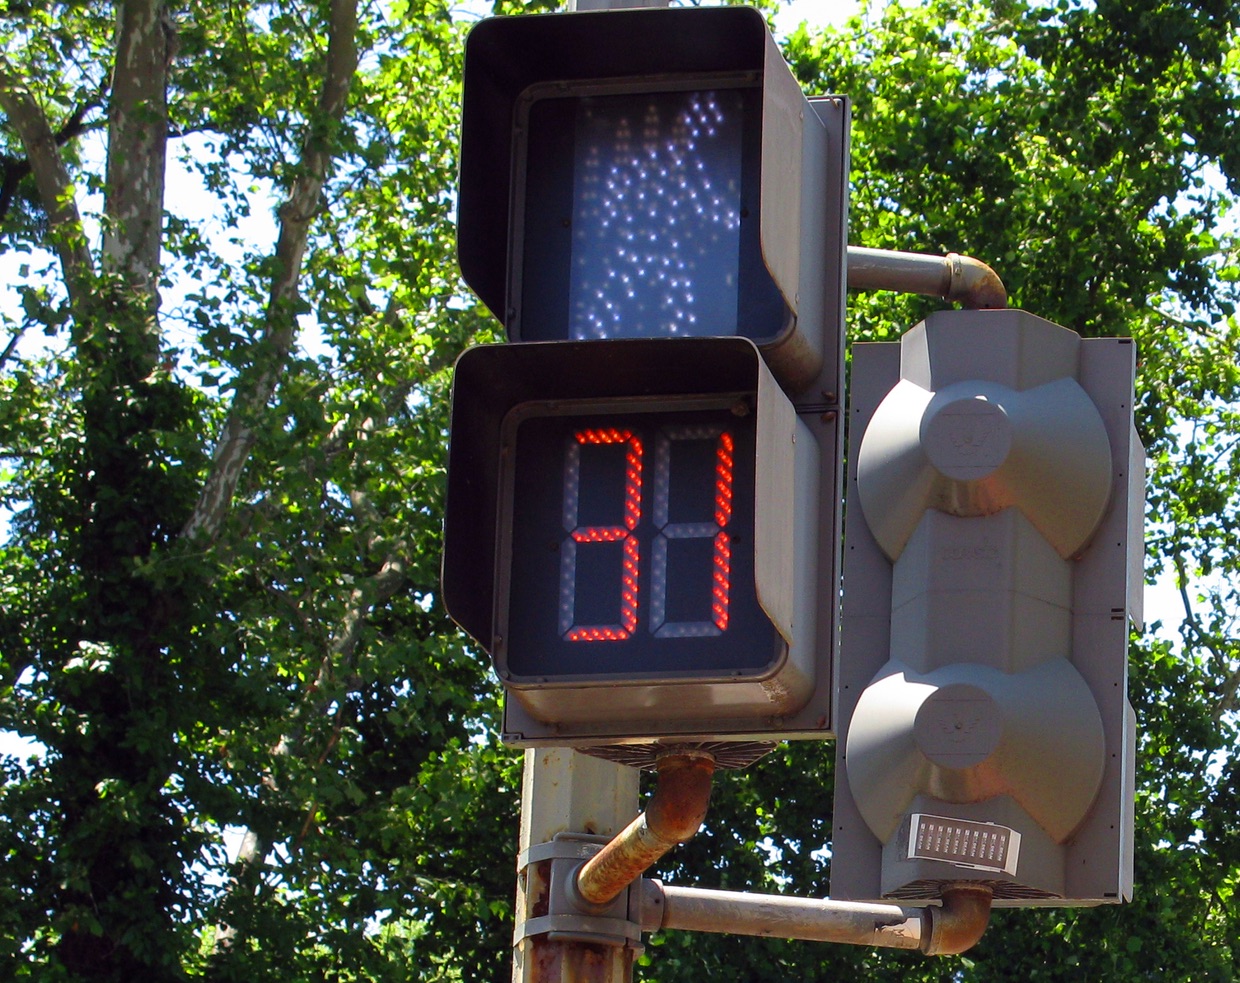
This got me (over)thinking: if I want to know how much time is left, is it better to see the right side of the countdown timer (approaching from the left), or the left side (approaching from the right)? In other words, does the left or right side of the display carry more information?
These timers use seven-segment displays. Even if you didn’t know they were called seven-segment displays, you see them all over the place. They use seven separate segments, labeled A–G, to create each of the 10 digits from 0–9.
To form each of the ten digits, the seven segments are turned on (1) or off (0) in different combinations. Here are the standard representations of 0–9.
| A | B | C | D | E | F | G | |
|---|---|---|---|---|---|---|---|
|
|
1 | 1 | 1 | 1 | 1 | 1 | 0 |
|
|
0 | 1 | 1 | 0 | 0 | 0 | 0 |
|
|
1 | 1 | 0 | 1 | 1 | 0 | 1 |
|
|
1 | 1 | 1 | 1 | 0 | 0 | 1 |
|
|
0 | 1 | 1 | 0 | 0 | 1 | 1 |
|
|
1 | 0 | 1 | 1 | 0 | 1 | 1 |
|
|
1 | 0 | 1 | 1 | 1 | 1 | 1 |
|
|
1 | 1 | 1 | 0 | 0 | 0 | 0 |
|
|
1 | 1 | 1 | 1 | 1 | 1 | 1 |
|
|
1 | 1 | 1 | 1 | 0 | 1 | 1 |
The seven segments aren’t on all turned on an equal number of times over the course of the ten digits. That means seeing some segments turned on is more probable than others.
| On for how many digits? | |
|---|---|
| Segment A | 8/10 |
| Segment B | 8/10 |
| Segment C | 9/10 |
| Segment D | 7/10 |
| Segment E | 4/10 |
| Segment F | 6/10 |
| Segment G | 7/10 |
So how can we tell which of these seven segments communicates the most information?
Information entropy
The segments that are on or off for close to half the digits contain more information than those that are either on or off for most digits.
This is intuitive for the same reason a fair coin toss contains more information than tossing a coin with heads on both sides: you’re less certain what you’re going to get, so learn more by observing the value.
Claude Shannon’s[1] concept of entropy from information theory is a good way to quantify this problem. Entropy, , is defined as
Here’s what’s that means in the case of a seven-segment display. is a random variable representing whether a segment is on or off. Since a segment can only have two states, the random variable 's actual values are either on or off. is the probability operator, so really means the probability that a segment is on or off. ( is the base of the logarithm. We’re going to use 2 because we like bits.)
Let’s take segment A as an example. It’s on for 8 out of 10 digits, and off for 2 out of 10. That means the probability of seeing it on is 0.8, and the probability of seeing it off is 0.2. In other words (well, symbols), and .
Plugging that in,
In Shannon’s terms, there are 0.722 bits of information communicated by segment A of a seven-segment display.
Doing this for all seven segments, we get these entropy values:
| Shannon entropy | |
|---|---|
| Segment A | 0.721928 |
| Segment B | 0.721928 |
| Segment C | 0.468996 |
| Segment D | 0.881291 |
| Segment E | 0.970951 |
| Segment F | 0.970951 |
| Segment G | 0.881291 |
It sure looks like segments E and F carry the most information. That makes sense because they’re the closest to being on/off 50% of the time. Guess it’s better to approach an intersection from the right in order to see the left-hand segments.
But wait.
When approaching an intersection, you can see both right segments (B and C), or both left segments (E and F). A pair of segments from a single display are anything but independent because they’re both showing part of the same digit, so we can’t just add up their entropies.
Instead, treat each pair as if it holds a single value. Taken together, two segments can take on any of four values (off–off, off–on, on–off, on–on), which is binary for 0–3.
| Segments B & C | Binary | Decimal | |
|---|---|---|---|
|
| On – On | 11 | 3 |
|
| On – On | 11 | 3 |
|
| On – Off | 10 | 2 |
|
| On – On | 11 | 3 |
|
| On – On | 11 | 3 |
|
| Off – On | 01 | 1 |
|
| Off – On | 01 | 1 |
|
| On – On | 11 | 3 |
|
| On – On | 11 | 3 |
|
| On – On | 11 | 3 |
| Segments E & F | Binary | Decimal | |
|---|---|---|---|
|
| On – On | 11 | 3 |
|
| Off – Off | 00 | 0 |
|
| On – Off | 10 | 2 |
|
| Off – Off | 00 | 0 |
|
| Off – On | 01 | 1 |
|
| Off – On | 01 | 1 |
|
| On – On | 11 | 3 |
|
| Off – Off | 00 | 0 |
|
| On – On | 11 | 3 |
|
| Off – On | 01 | 1 |
In this case, our random variable can take on four possible values rather than just two. Taking segments E and F as an example, the joint value is 0 for 3/10 digits, 1 for 3/10 digits, 2 for 1/10 digits, and 3 for 3/10 digits. Going back to the initial definition of entropy, we get
So we get 1.16 bits of information in joint segments B–C, and 1.90 bits in joint segments E–F. So there you have it: it’s still better to approach an intersection from the right.
But wait!
When was the last time you walked up to an intersection and only saw the timer on one number? If you look for at least half a second (on average), you’ll see it tick down.
Luckily, Wikipedia says that
For a first-order Markov source (one in which the probability of selecting a character is dependent only on the immediately preceding character), the entropy rate is:
where is a state (certain preceding characters) and is the probability of given as the previous character.
But actually, I don’t like this notation, so I’m going to rewrite it as
Alright, then. The probability of seeing a given state is the same as before. As for the conditional probabilities, let’s go back to the 0–3 binary values and assume 0 loops back to 9[2]. If we see segments B and C in a 1 state (off–on), the next tick it will be in a 1 state half the time, and a 3 state half the time. Going through the rest of the states and transitions, we get these transition probabilities:

So for segments E and F, when and , as with before, and because, as those circles show, a 0 transitions to a 2 a third of the time.
Now it’s just a matter of an inelegant nested for loop to determine that the first-order entropy rate of segments B–C is 1.00 bits, and 1.03 bits for segments E–F.
So, if you can manage to stare at either the left or right segments for a whole second, you’re still better off looking at the left segments, but not by much.
I’ll leave figuring out the entropy rates for looking at it longer as an exercise for the reader, because I’m done overthinking this (for now).
The 7-segment display CSS is on CodePen.